Menu
Y-DNA Haplogroup • Paternal Lineage

NO1 [K2

Y-DNA Haplogroup NO1 [K2

~40,000 years ago
Southeast Asia
1 subclades
Scroll to explore
Chapter I

The Story

The journey of Y-DNA haplogroup NO1 [K2

Origins and Evolution

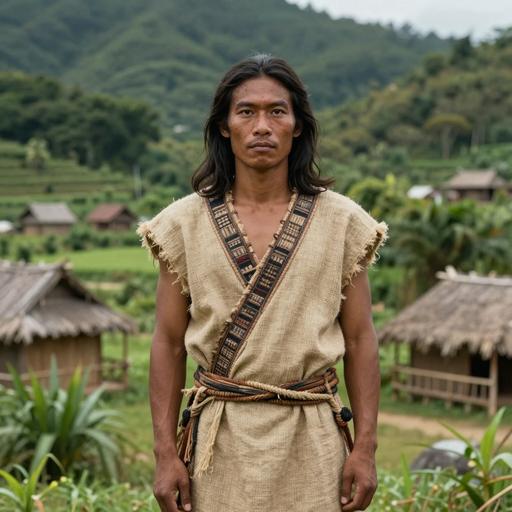
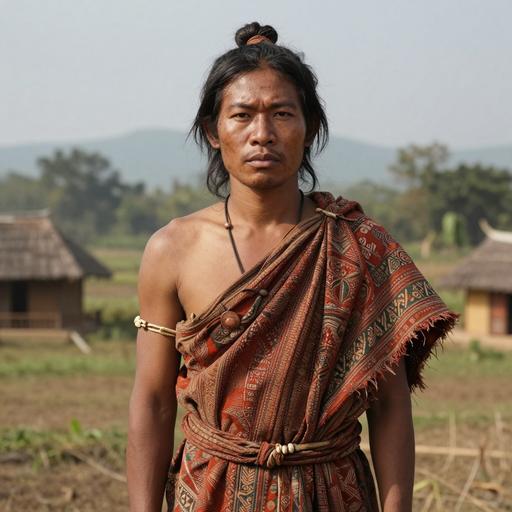
Y-DNA haplogroup NO1 occupies an important intermediate position within the Y-chromosome phylogeny as the ancestral node linking the major clades N and O. Current population-genetics and phylogeographic evidence indicates NO1 arose in Mainland or Island Southeast Asia in the Upper Paleolithic, approximately 40 thousand years ago (kya). From this ancestral node, two broad daughter lineages emerged: haplogroup N, which later expanded northward into Siberia and northern Eurasia, and haplogroup O, which radiated through East and Southeast Asia and became predominant in many modern East Asian and Austronesian-speaking populations.

NO1 itself is rarely observed in modern samples as a stable, isolated terminal lineage because most living male lineages belong to one of its descendant clades (N or O) or to further downstream subclades. However, basal or near-basal NO1 markers can sometimes be detected in population surveys and ancient DNA, providing a snapshot of the deep split that structured much of Eurasian Y-chromosome diversity.

Subclades (if applicable)

The principal subclades descending from the NO1 node are N and O. These two branches subsequently diversified into numerous sublineages:

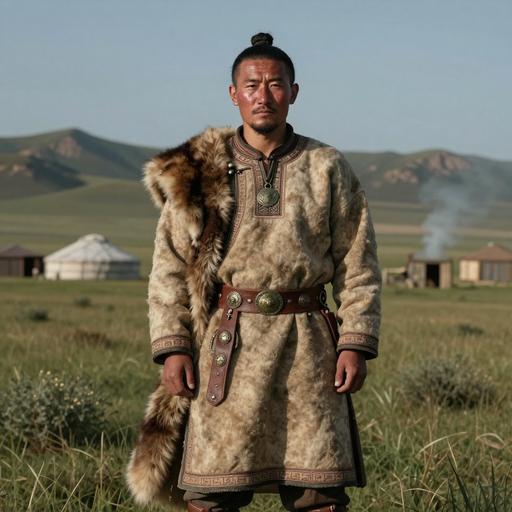
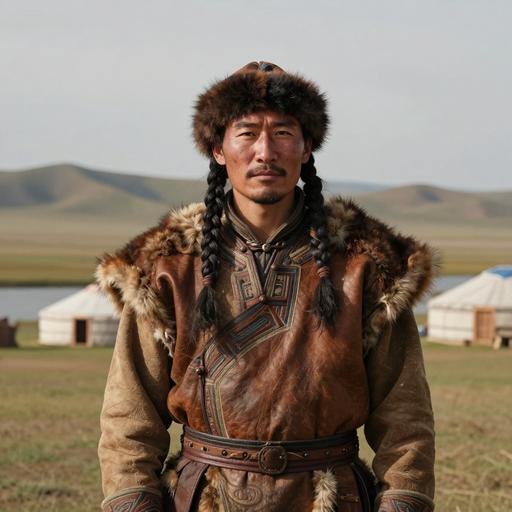
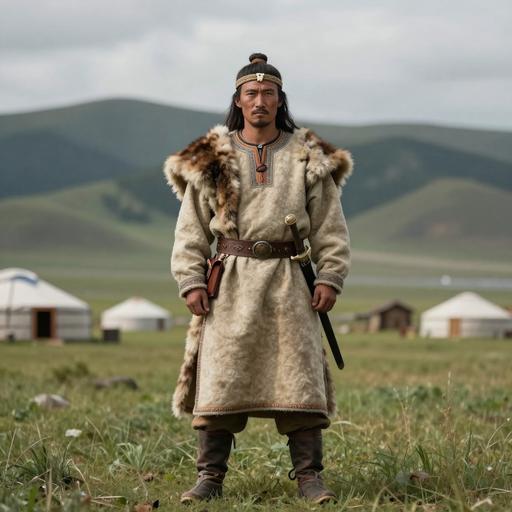
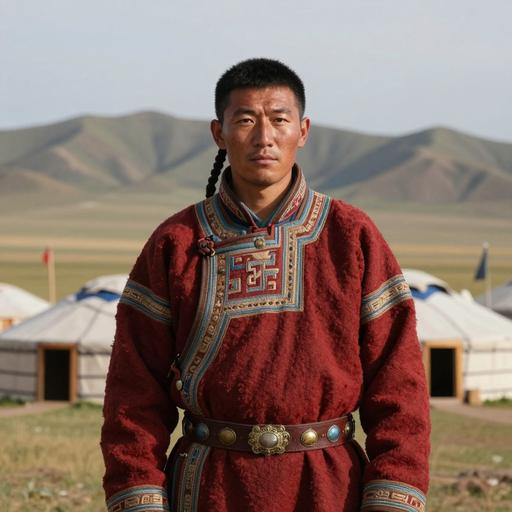
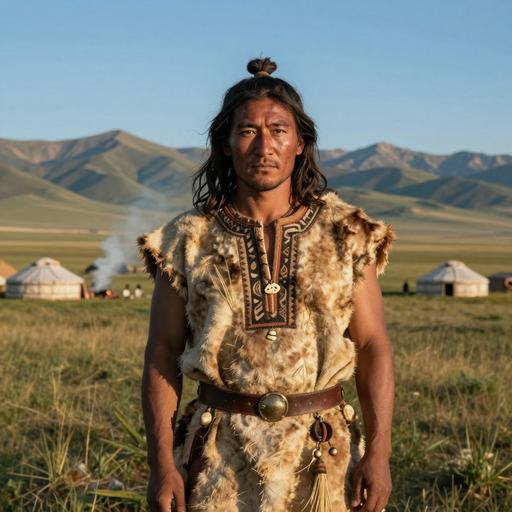
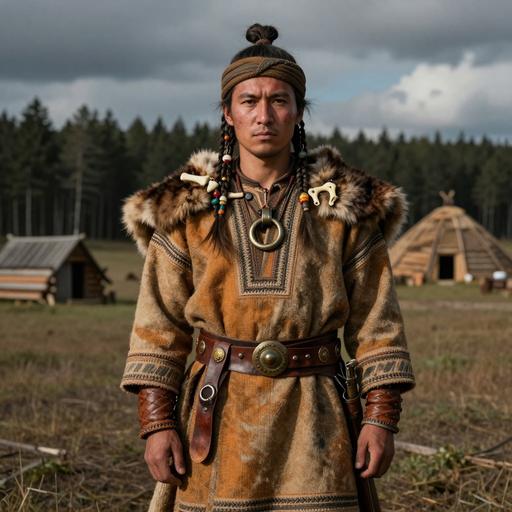
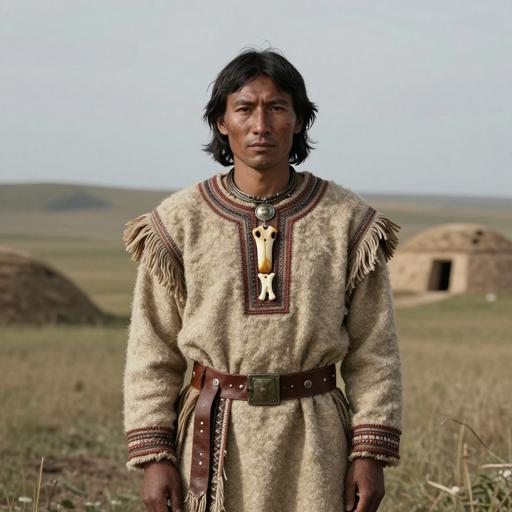
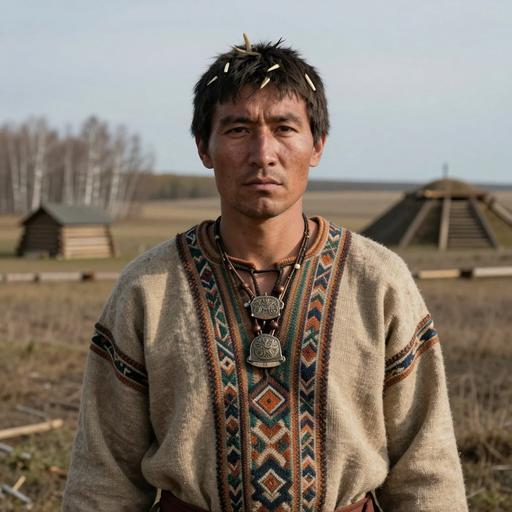
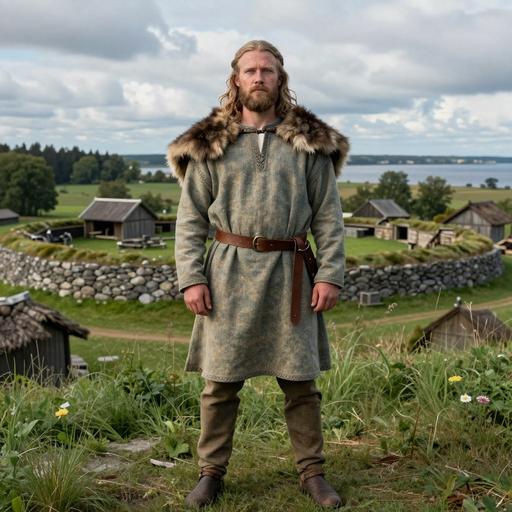
  • N: Predominant in northern Eurasia and associated with populations of Siberia, northeastern Europe, and some Uralic-speaking groups. Important downstream subclades (e.g., N1, N2) reflect post-glacial and later expansions.
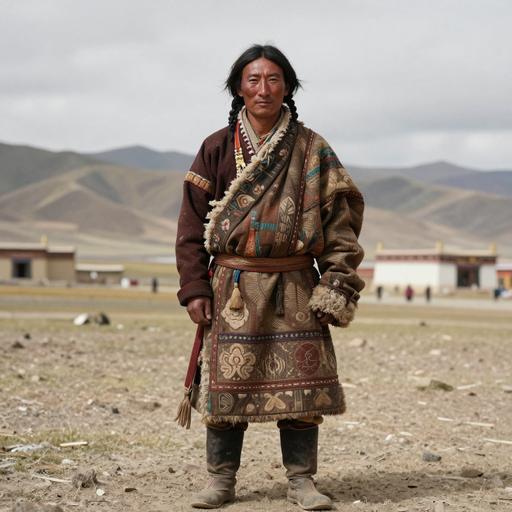
  • O: Extremely common across East and Southeast Asia and among Austronesian, Tai-Kadai, Hmong-Mien and many Sino-Tibetan speaking groups. Major downstream clades (e.g., O1, O2 and their sublineages) are linked to Paleolithic settlement as well as Neolithic and later demic expansions connected to farming.

NO1 functions primarily as a phylogenetic connector rather than a widely distributed terminal haplogroup; most diversity observed in modern and ancient samples is carried by the descendant N and O subclades.

Geographical Distribution

Because NO1 is an ancestral node, its modern signal is distributed via the geographic ranges of its descendants. In broad terms:

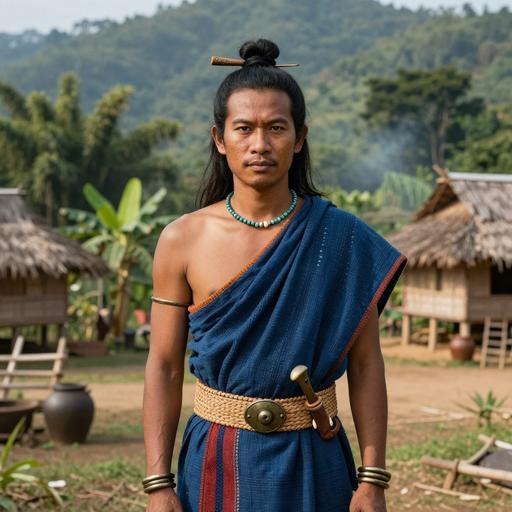
  • East Asia and Southeast Asia carry the bulk of the NO-derived diversity through haplogroup O and its many subclades.
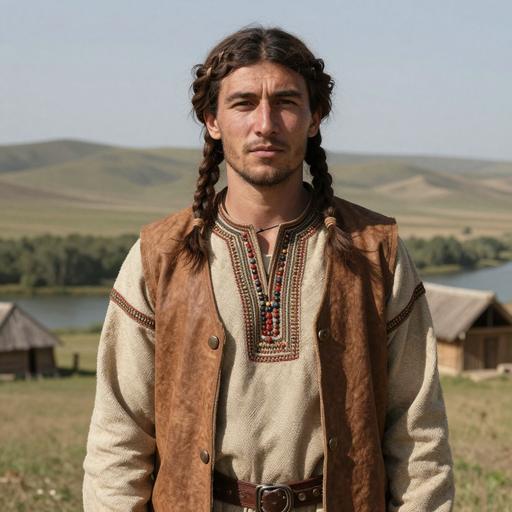
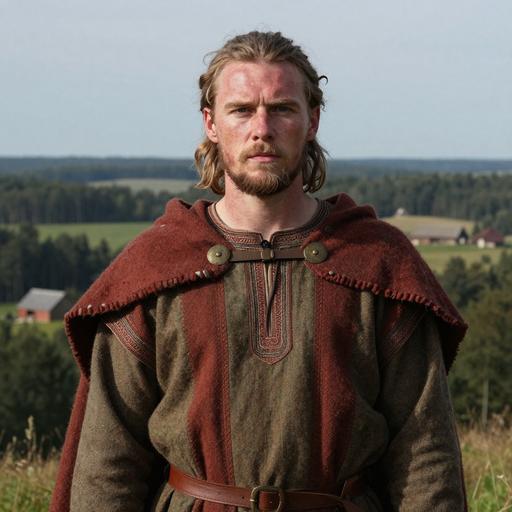
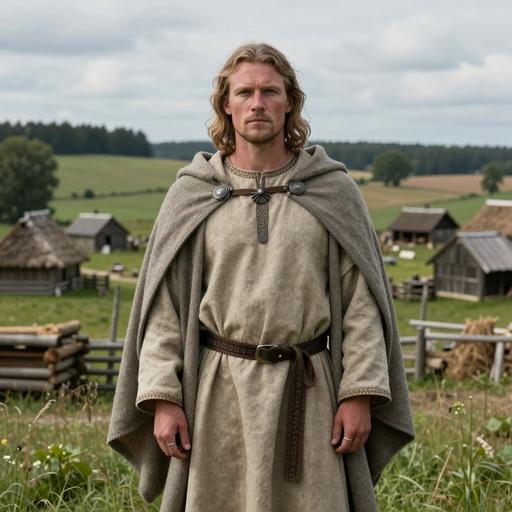
  • Northern Eurasia and parts of Eastern Europe reflect expansions of haplogroup N that trace back to the NO1 split.
  • Central, South, and Southeast Asia sometimes show lower-frequency NO-derived lineages due to secondary migrations and local admixture.

Basal or near-basal NO1 markers are most plausibly detected in Southeast Asia and adjacent regions where the initial divergence likely occurred, while downstream clades reflect later, region-specific demographic processes.

Historical and Cultural Significance

Although NO1 predates recognizable archaeological cultures, its descendant lineages played central roles in many later demographic and cultural transformations:

  • The spread of haplogroup O is tightly linked with the peopling and cultural developments of East and Southeast Asia, including expansions associated with Neolithic agriculture and the formation of language families such as Austroasiatic, Austronesian and Sino-Tibetan.
  • Haplogroup N is associated with post-glacial re-peopling of northern Eurasia and later movements that contributed to the genetic ancestry of some Uralic-speaking and Siberian populations.

Thus, NO1 is important for understanding how deep Upper Paleolithic divergences set the stage for subsequent Neolithic and later cultural expansions across Eurasia. Its role is primarily as a deep-time anchor that explains why many culturally and linguistically distinct groups share related paternal ancestry.

Conclusion

Y-DNA haplogroup NO1 is best understood as an early intermediate node in the paternal tree of Eurasia, arising in Southeast Asia ~40 kya and giving rise to two major radiations: N in the north and O across East and Southeast Asia. While NO1 itself is rarely the terminal lineage in modern populations, recognizing its position clarifies the deep-time relationships and migration pathways that shaped the distribution of Y-chromosome diversity across Eurasia.

Key Points

  • Origins and Evolution
  • Subclades (if applicable)
  • Geographical Distribution
  • Historical and Cultural Significance
  • Conclusion
Chapter II

Tree & Relationships

Phylogenetic context and subclades

Evolution Path

This haplogroup's evolutionary journey from its earliest ancestor to the present.

Steps Haplogroup Age Estimate Archaeology Era Time Passed Immediate Descendants Tested Modern Descendants Ancient Connections
1 NO1 [K2 Current ~40,000 years ago 🦴 Paleolithic 40,000 years 1 0 0
Chapter III

Where in the World

Geographic distribution and modern presence

Place of Origin

Southeast Asia

Modern Distribution

The populations where Y-DNA haplogroup NO1 is found include:

  1. East Asians (e.g., Chinese, Japanese, Koreans)
  2. Southeast Asians (e.g., Vietnamese, Indonesians, Filipinos)
  3. Central Asians (in lower frequencies)
  4. Some populations in Siberia
  5. Some populations in Northern Europe (through its descendant haplogroup N)
  6. Some populations in South Asia (in lower frequencies)

Regional Presence

East Asia High
Southeast Asia High
Central Asia Low
Northern Asia / Siberia Low
Northern Europe Low
South Asia Low
CHAPTER IV

When in Time

Your haplogroup in the context of human history

~50k years ago

Upper Paleolithic

Advanced tool-making, art, and cultural explosion

~40k years ago

Haplogroup NO1 [K2

Your Y-DNA haplogroup emerged in Southeast Asia

Southeast Asia
~20k years ago

Last Glacial Maximum

Peak of the last ice age, populations isolated

~10k years ago

Neolithic Revolution

Agriculture begins, settled communities form

~5k years ago

Bronze Age

Metalworking, writing, and early civilizations

~3k years ago

Iron Age

Iron tools, expanded trade networks

~2k years ago

Classical Antiquity

Greek and Roman civilizations flourish

Present

Present Day

Modern era

Your Haplogroup
Historical Era
Chapter IV-B

Linked Cultures

Ancient cultures associated with Y-DNA haplogroup NO1 [K2

Cultural Heritage

These ancient cultures have been linked to haplogroup NO1 [K2 based on matching ancient DNA samples from archaeological excavations. The presence of this haplogroup in these cultures provides insights into the migrations and population movements of populations carrying this haplogroup.

Early Buryat Kuenga Culture Lena River Culture Lokomotiv Culture Shamanka Culture
Culture assignments are based on archaeological context of ancient DNA samples and may represent regional associations during specific time periods.
Chapter V

Sample Catalog

Top 50 ancient DNA samples directly related to haplogroup NO1 [K2 or parent clades

50 / 50 samples
Portrait Sample Country Era Date Culture Y-DNA Match
Portrait of ancient individual I15156 from Taiwan, dated 1 CE - 800 CE
I15156
Taiwan Iron Age Taiwan 1 CE - 800 CE Taiwanese Iron NO-M214 Direct
Portrait of ancient individual KHO007 from Mongolia, dated 26 CE - 125 CE
KHO007
Mongolia Middle to Late Bronze Age to Xiongnu to Late Medieval Khovd, Mongolia 26 CE - 125 CE Khovd Long-Term N-Tat Direct
Portrait of ancient individual DA171 from Lithuania, dated 50 CE - 650 CE
DA171
Lithuania Late Antiquity Lithuania 50 CE - 650 CE Lithuanian Late Antiquity N-L1025 Direct
Portrait of ancient individual DA171 from Lithuania, dated 50 CE - 650 CE
DA171
Lithuania Late Iron Age Baltic Region 50 CE - 650 CE N-L1025 Direct
Portrait of ancient individual YUR001 from Mongolia, dated 52 BCE - 62 CE
YUR001
Mongolia Xiongnu Period Selenge, Mongolia 52 BCE - 62 CE Xiongnu Culture N-Y125475 Direct
Portrait of ancient individual IMA005 from Russia, dated 169 BCE - 44 BCE
IMA005
Russia Xiongnu Period Buryatia, Russia 169 BCE - 44 BCE Xiongnu Buryat N-P89 Direct
Portrait of ancient individual SON001 from Mongolia, dated 200 BCE - 100 CE
SON001
Mongolia Xiongnu Period Tuv, Mongolia 200 BCE - 100 CE Xiongnu Tuv N-CTS6380 Direct
Portrait of ancient individual BGD004 from Russia, dated 200 BCE - 1 BCE
BGD004
Russia Iron Age Sargat Culture, Russia 200 BCE - 1 BCE Sargat Culture N-L839 Direct
Portrait of ancient individual VK579 from Sweden, dated 200 CE - 400 CE
VK579
Sweden Iron Age Sweden 200 CE - 400 CE Nordic Iron Age N1a1a1a1a Direct
Portrait of ancient individual VK579 from Sweden, dated 200 CE - 400 CE
VK579
Sweden Iron Age Nordic Region 200 CE - 400 CE N-L550 Direct
Chapter VI

Carrier Distribution Map

Geographic distribution of 100 ancient DNA samples carrying haplogroup NO1 [K2

Time Period Filter
All Time Periods
Showing all samples
Each marker represents an ancient individual
Chapter VII

Temporal Distribution

Distribution of carriers across archaeological periods

Chapter VIII

Geographic Distribution

Distribution of carriers by country of origin

Chapter IX

Country × Era Distribution

Cross-tabulation of carrier countries and archaeological periods

Data

Data & Provenance

Source information and data quality

Last Updated 2026-02-16
Confidence Score 50/100
Coverage Low
Data Source

We use the latest phylotree for YDNA haplogroup classification and data.